Keeping track of your student's progress when using a teaching a task analyzed skill can be a difficult process. Not only do you have to try to figure out their overall progress, but you also have to keep track of how well the student is performing with each step. Wouldn't it be nice if there was an easier way?
Well, this just might help. It is a program that:
- Keeps track of student data for skills broken down into a task analysis,
- Graphs their overall progress, and
- Individually analyzes their performance of each step
With this program, you will want to make sure that you are using "backward chaining" to teach your task analyzed skills. This essentially means that you immediately prompt the student through each step except for the last one in the sequence because you are teaching that step. Then you only remove the prompt from the second-to-last step after the student has mastered the last step, and so on...
The way that this data program has been used in the classroom is to take the data with pencil and paper. Then enter the data into the program at the end of the day. A separate file is needed for each lesson, but it is a relatively easy task to enter the information into the computer - especially for the benefit that you receive!
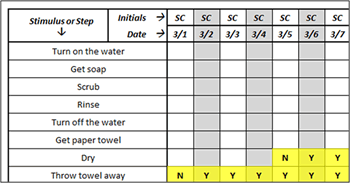
There is a specific way to record data as well. As we said before, you will want to take data on the last step in the sequence first. So, we typically highlight the target step, and only take data on that step (since it is the only one that we are teaching). We don't take data on the other steps until we are actually teaching them to the student. When the program tells us to "Add Next Step", we highlight the second to last step on the paper data form to remember that we are teaching that step too. Just like below:
Also, this program works for analyzing data for probe data taken on lessons with multiple stimuli. See this page to learn more!
Let's see how this program works...
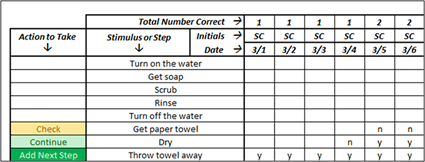
This first image is the step analysis. It tells you to either:
- "Continue" - The student is performing well with this step and has no problems. No intervention is necessary
- "Check" - Issues might be starting with this step. If you have time to look at this item, that would be good. But it isn't a serious problem yet.
- "Intervene" - The student is having significant problems with this step, and this requires observation and intervention because the typical teaching methods aren't working for this student.
- "Add Next Step" - If the student performs a step in the task analysis correctly three sessions in a row, then it is considered a mastered step. The program will tell you to add the next step, and you can then remove the immediate prompts from that step and start teaching it.
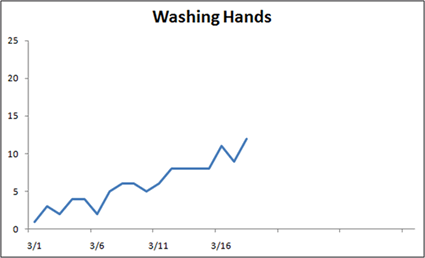
This next image shows the graph that is made. You'll notice that it is "cumulative", which means that it shows the student's overall performance rather than just their progress on a single step. This is because in truth, we don't really want to see how well the student knows to "rinse", we want to see how far along he is to doing the whole process and washing his hands, right?